-
SFRplus module use
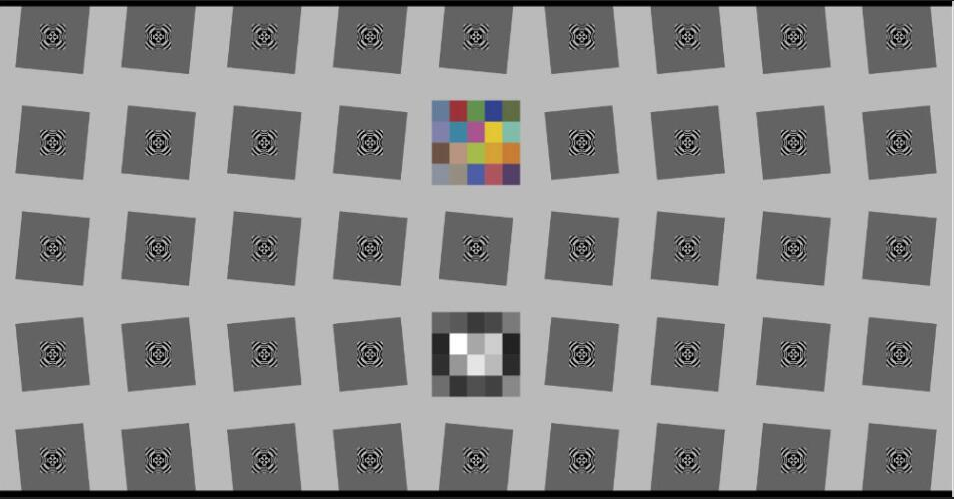
Figure 3.5.1 SFRplusThe above picture shows the SFRplus test card. As you can see from the figure, the test card contains SFR bevel, grayscale, and color blocks, which can be used for measurement resolution (SFR), color reduction, grayscale (noise, OECF, Gamma). ), in addition to the above, can also test distortion, uniformity, field of view.
Find the SFRplus thumbnail (resolution test card) in the main iQstest window, as shown below:
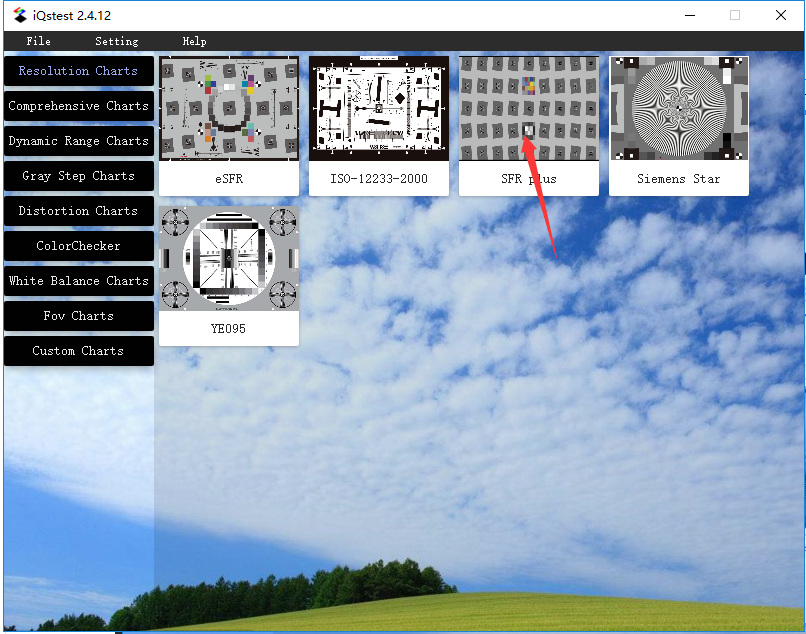
Figure 3.5.2 main interfaceClick on the thumbnail and the configuration window will pop up:
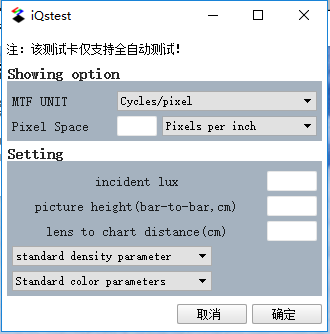
Figure 3.5.3 SFRplus ConfigurationAs can be seen from Figure 3.5.3, the configuration window is the same as the eSFR configuration, so I won't go into details here. Please see the eSFR configuration for details.
After the configuration is complete, click “确认” to pop up the file selection box and import the SFRplus image to be used for testing. The software will automatically locate and analyze the image and show the situation after automatic positioning:
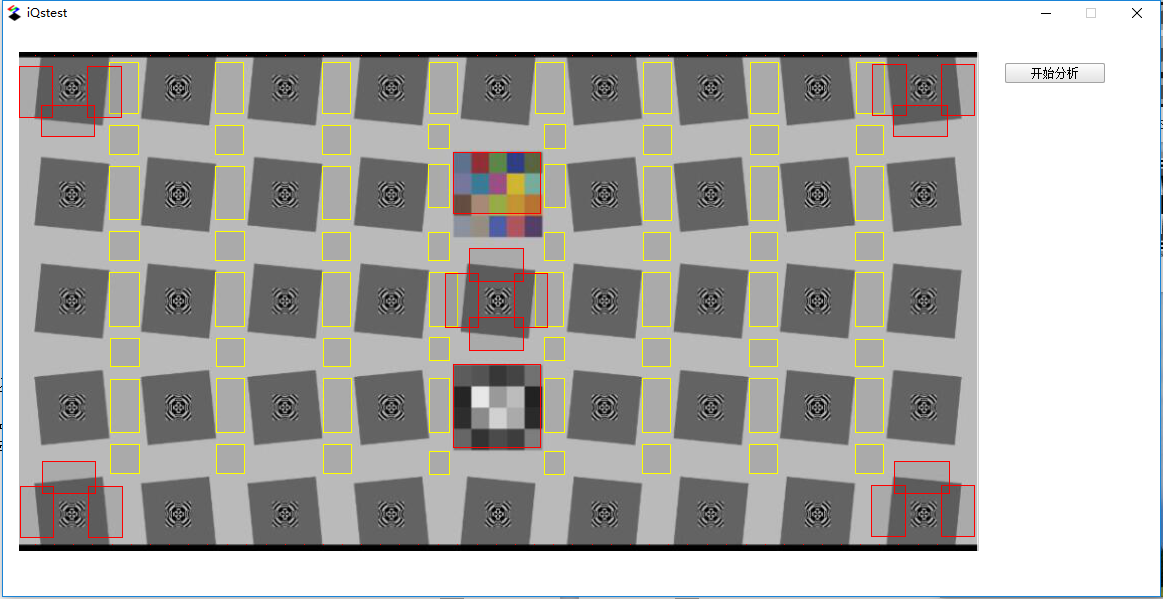
Figure 3.5.4 SFRplus automatic positioningAfter confirming that there is no problem with the positioning in Figure 3.5.4, click the “Start Analysis” button, the software will call the function module to analyze the test image, and the analysis result will pop up. Please see the results of the next section.
Result display
After the analysis is complete, the results will pop up automatically:
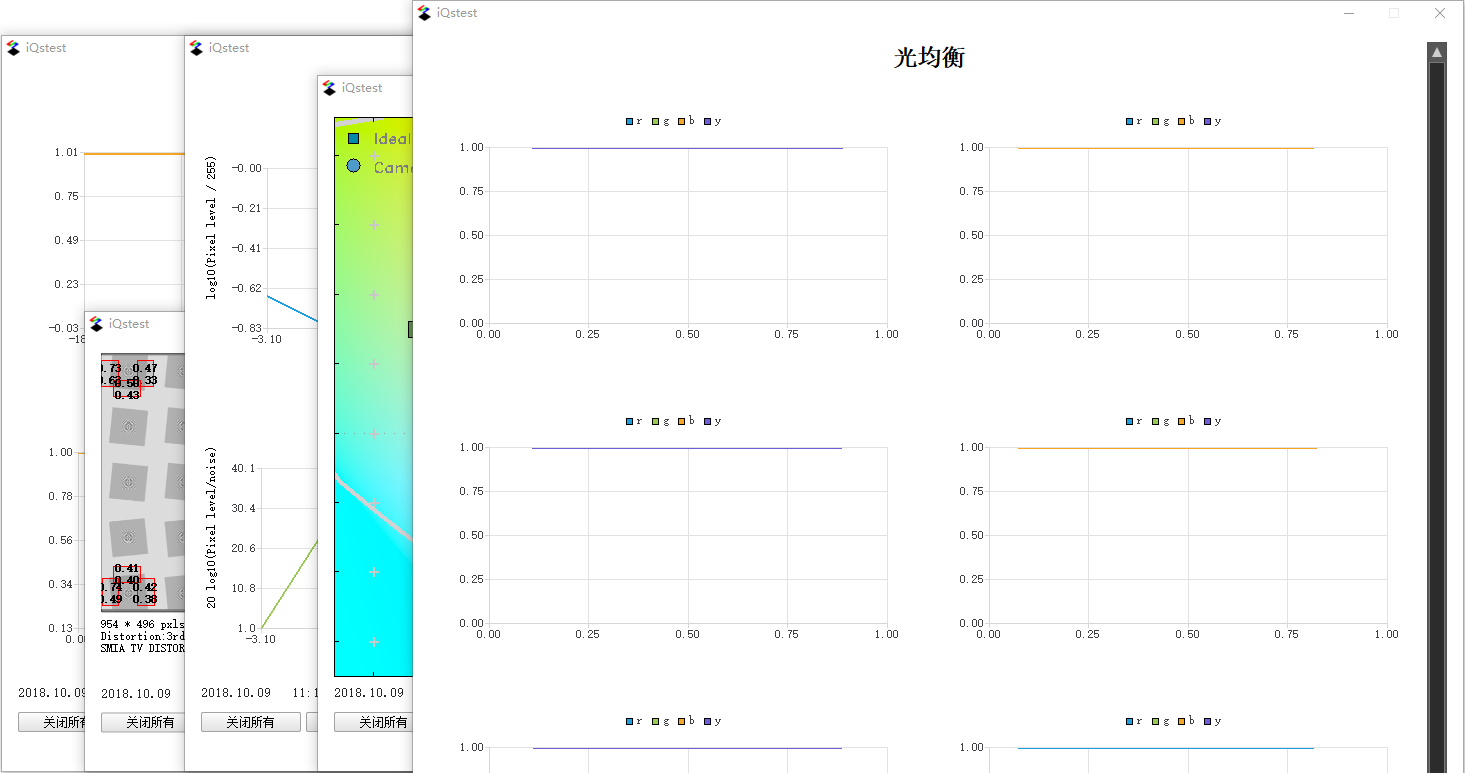
Figure 3.5.5 SFRplus results presentationDetailed results:
SFRplus is mainly capable of testing SFR, grayscale, color reproduction, optical equalization, etc.
1) SFR (resolution)
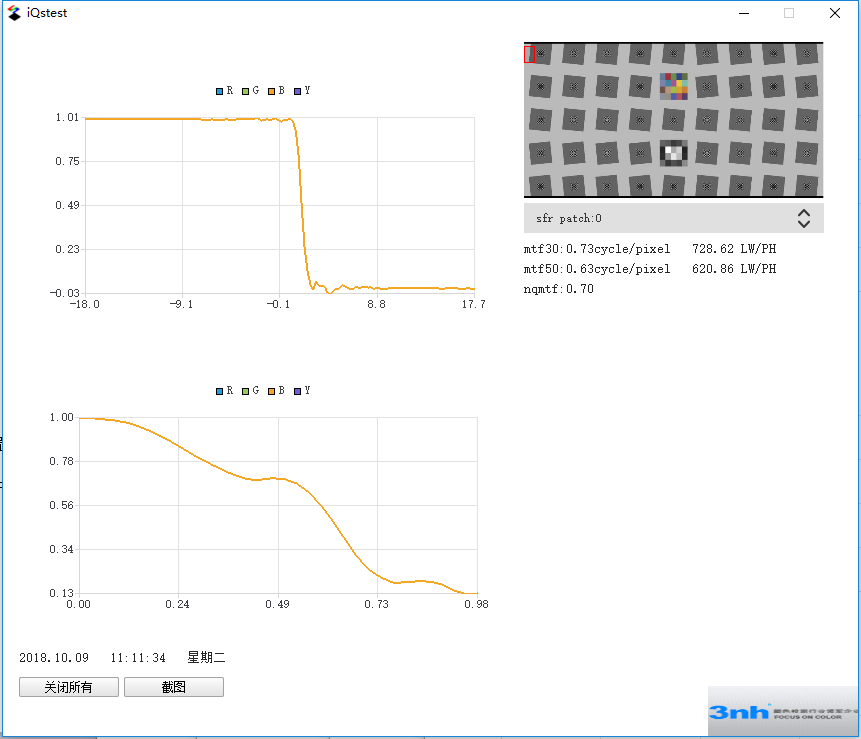
Figure 3.5.6 SFR resolutionIn the above figure, the first chart is the ESF curve, the second chart is the MTF curve, and the right side can be selected in the drop-down box. Three index values of MTF30, MTF50, and NQMTF are given for each hypotenuse.
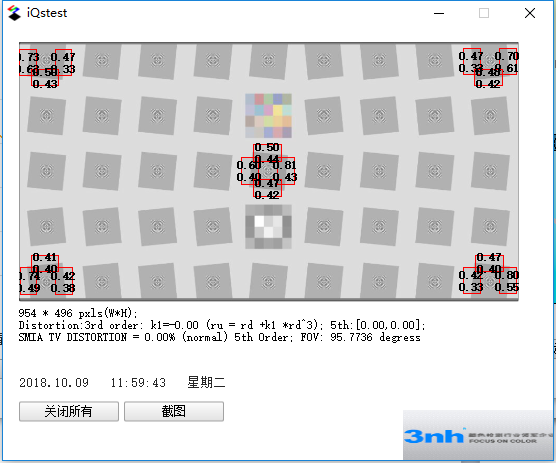
Figure 3.5.7 SFR synthesisFigure 3.5.7 is a comprehensive display of SFR resolution. For each hypotenuse, the previous number is MTF30, and the next digit is the value of MTF50 in units of cycle/pixel.
The distortion estimates and the field of view estimates are given below.
Distortion valuation:
There are two kinds of distortion evaluation schemes:
1. SMIA TV distortion;
2. The upper and lower black lines are fitted with distortion (third-order and fifth-order distortion fitting);
Field of view angle estimation: Only the diagonal field of view angle is given here. (Note: you need to input the image height in the configuration window, the distance from the lens to the test card. If you need more professional test field angle, please purchase the test field angle. Test the card and test it with the field of view test module);
2) Color reproduction
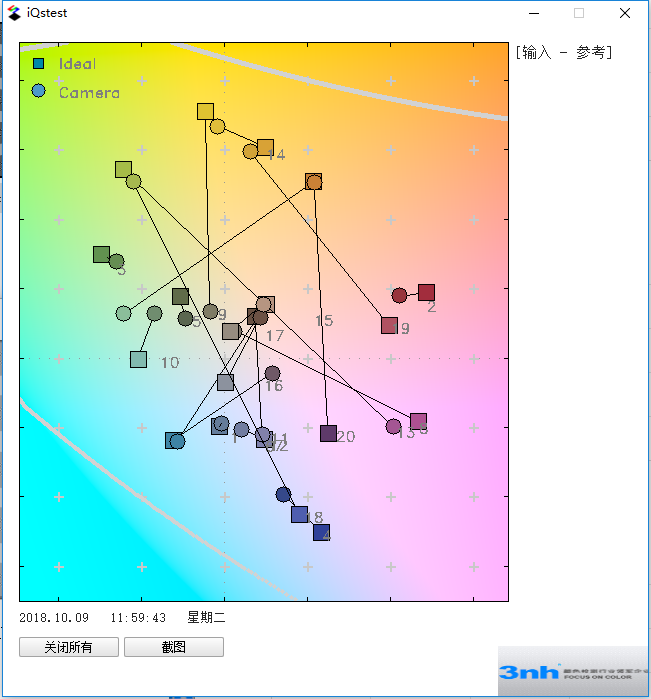
Figure 3.5.8 Color RestoreIn Figure 3.5.8, the circle is the standard color value, the rectangle is the actual patch pixel value taken by the camera, and the longer the line segment between the circle and the rectangle, the worse the camera's ability to reproduce on the color, otherwise, the more it is good.
3) Grayscale
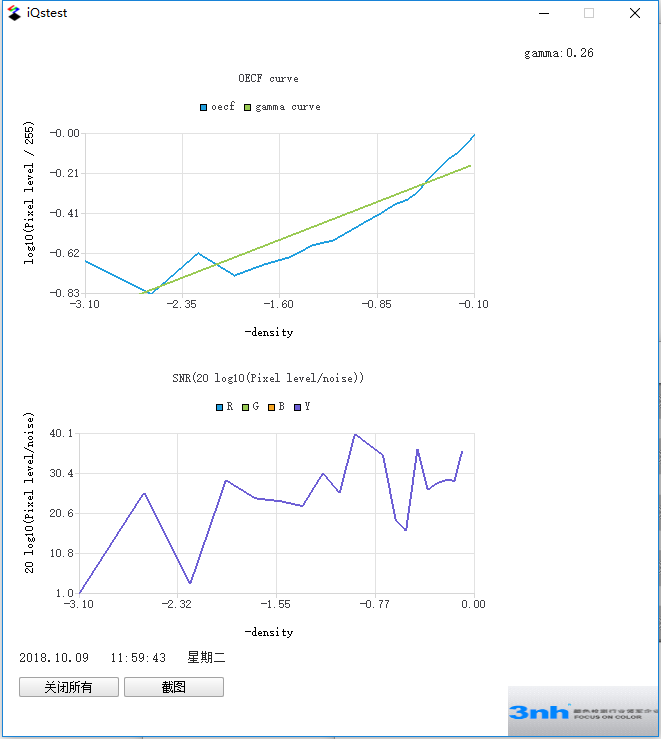
Figure 3.5.9 GrayscaleThe above figure is the grayscale analysis result of SFRplus. The first chart is the OECF curve. The slope of the curve is gamma, which can be used for image linearization. The second chart is SNR (signal-to-noise ratio) curve. The larger the SNR, the larger the image. The better the quality.