-
Siemens Star, s-SFR, can be used to detect multi-angle resolution.
Click on the "Resolution Test Card" on the main interface and you will find the thumbnail of Siemens Star on the right:
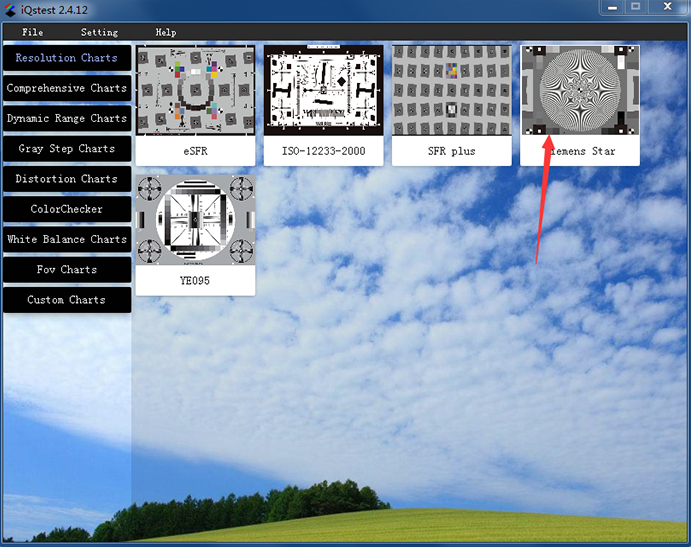
Figure 3.10.1 Main interface (Siemens Star)Click on the thumbnail to open the configuration window:
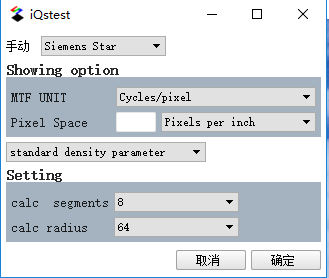
Figure 3.10.2 Siemens Star Configuration
Detailed configuration:
1. Display option: With the configuration part of the SFR module, the MTF indicator displayed in the result window can be changed by modifying the MTF unit;
2, given three standard density settings:
1) Standard density parameters;
2) Obtain density file path from configuration file;
3) Manually enter density;3. Settings:
1) Segmentation: The Siemens star is divided into 8, 16, 24 segments, which are detected in segments;
2) Radius level: radius sampling is performed for each Siemens star segment;4. Optional parameters: basic information of the test image, used for the result output;
After the configuration is complete, click the “确认” button, the file selection box will pop up, select the test image to be analyzed, and import, the ROI selection box will pop up:
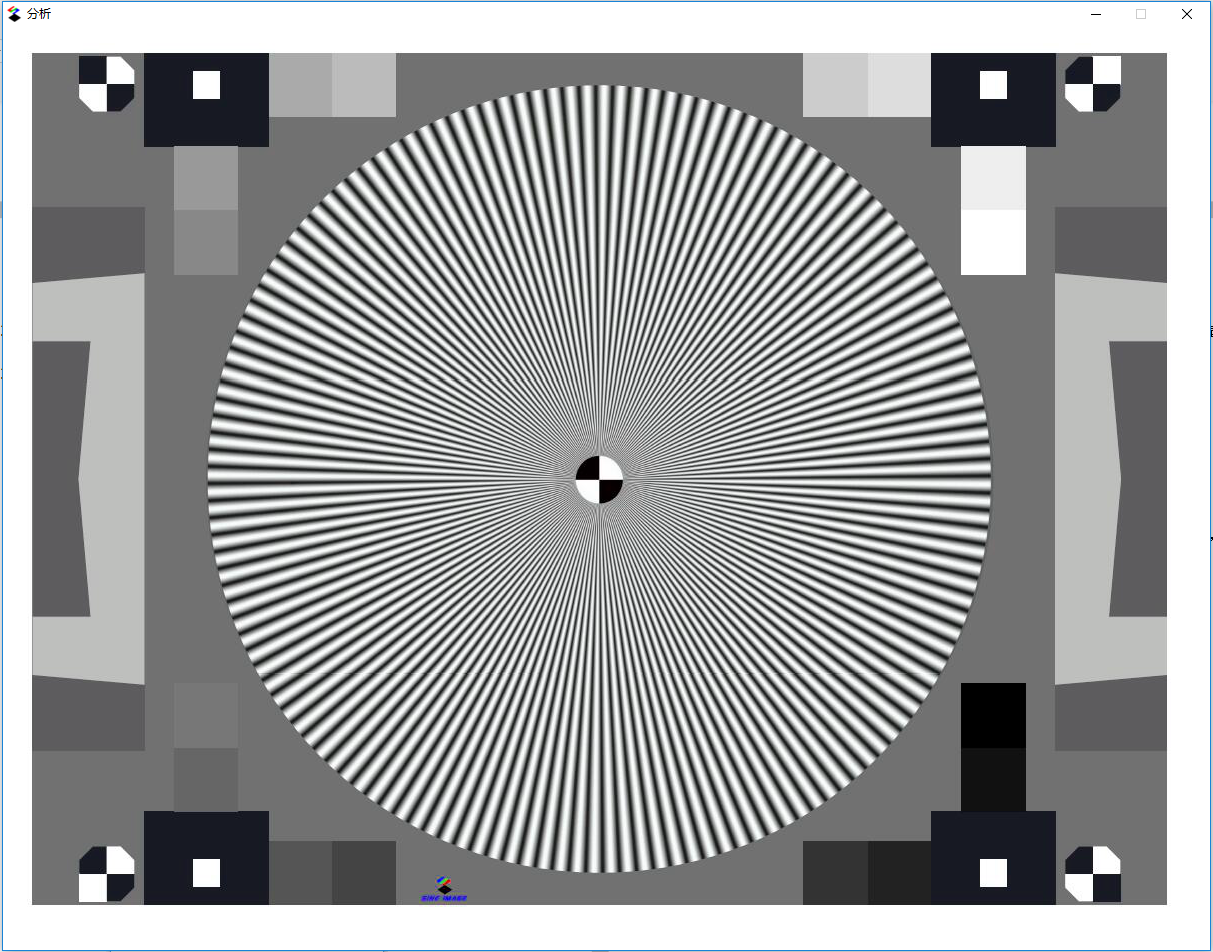
Figure 3.10.3 ROI Selection Window
By dragging the mouse, select the ROI in Figure 3.10.3 and select it according to the criteria in the figure below. After the selection, release the mouse, the ROI fine-tuning window of the following figure will pop up automatically:
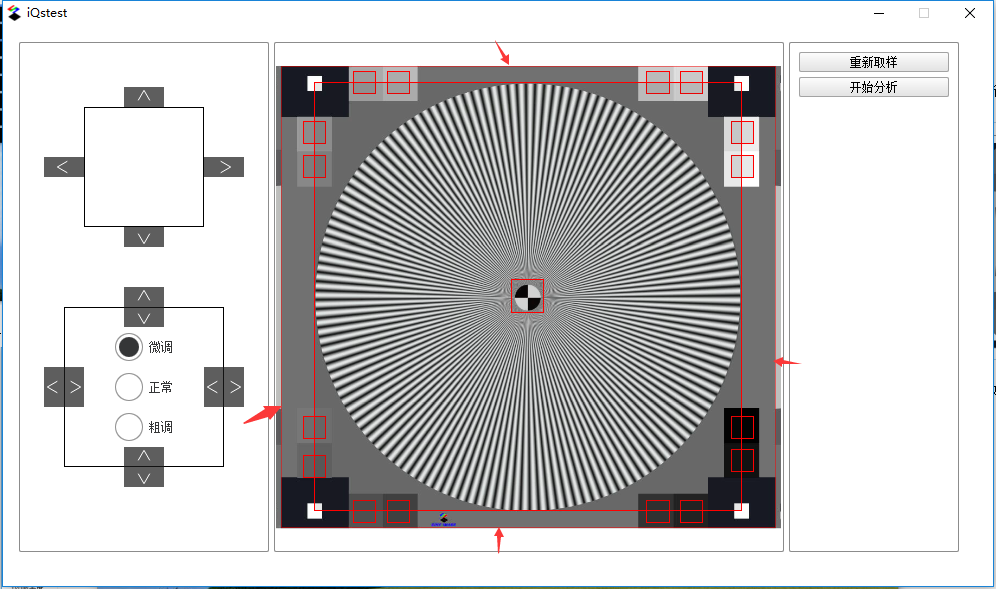
Figure 3.10.4 ROI fine-tuning window
In Figure 3.10.4, the left side is the fine-tuning control button (the upper four buttons control the overall movement of the ROI, the lower eight buttons control the edge movement of the ROI), and have three gears (fine adjustment, normal, coarse adjustment), through fine-tuning Ensure that the black and white positioning mark in the middle is in the middle of the red rectangle mark, and the four-corner gray level block is marked in the red rectangle. At the same time, it can be fine-tuned in the following ways:
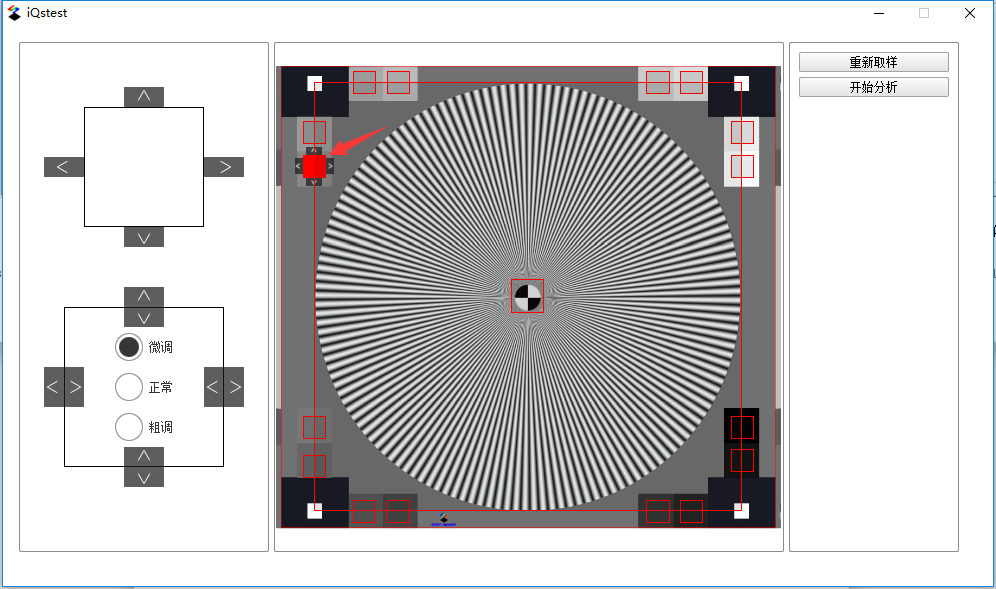
igure 3.10.5 Block trimming
Left click on the small block to be fine-tuned, and the fine-tuning button in Figure 3.10.5 will pop up around the small block. You can adjust the position of the small block by clicking the spin button, right click on the small block, and the surrounding fine-tuning button Will be hidden.
After fine-tuning, click the “Start Analysis” button on the right to call the function module for analysis. For the analysis results, please see the results in the next chapter.
1.1.1. Results display
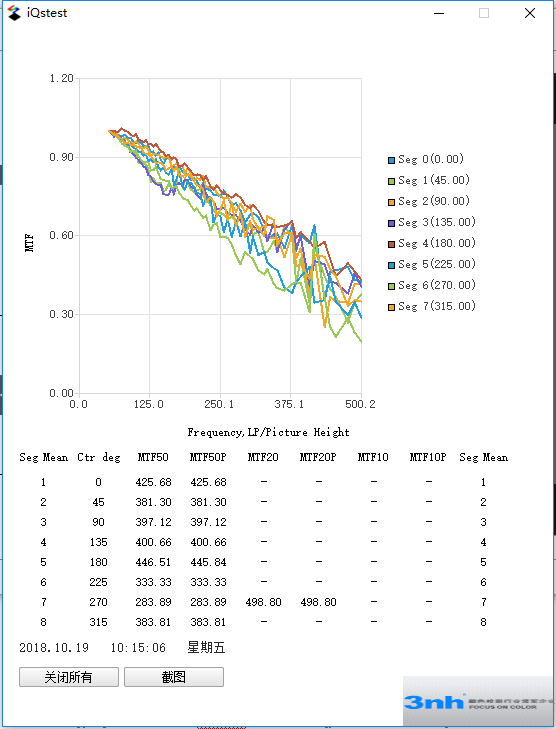
Figure 3.10.6 Siemens Star Analysis Results
After the Siemens star analysis is completed, Figure 3.10.6 will pop up. The graph shows the MTF curve of the first eight segments of the Siemens star. The abscissa is the spatial frequency (unit: LP/PH) and the ordinate is MTF. Below the chart are the MTF indicators for the first eight segments (MTF50, MTF50P, MTF20, MTF20P, MTF10, MTF10P, Note: “-” means unknown).